Toss Experiment: How to maximize toss height
In May I recorded some data with fellow cheerleaders. And have now been working to get the data to a format suitable for all kinds of analysis.
To make the experiment more valuable. I will also describe the data and what it is in hopes that this will help increase the understanding of the analysis results. And through that elevate the amount of learnings to be made from reading all this.
TL;DR
The more you can generate force in the beginning, from the moment the flyer starts to move up, the better. The first part sets the potential for the toss height.
Skip here to learn more about how this data can help you understand how to maximize toss height gains.
Explore the data yourself
The data from the whole experiment is visible in this web app, best viewed on a larger screen (eg. laptop).
The data that was captured
To provide some context, here is a description of how the data was captured, and what data did we get from it.
The data was collected with IMU sensors and suit by Movella. The data analysed was not the raw sensor data, but the human skeleton model output exported from MVN Analysis Software.
The experiment was done with 2 flyers and 2 bases. The weights and heights of participants were not recorded exactly.
The suit was worn and stunts executed in the following order
- 1st flyer suited up - does the protocol with 2 bases
- 2nd flyer suited up - does the protocol with 2 bases
- 1st base suited up - does protocol with 2 flyers
- 2nd base suited up - does protocol with 2 flyers
When the flyer was wearing the suit, I experimented with having an extra sensor on the bases forearm. To see if that data could be used to also estimate some interesting stunt metrics.
When the base wore the suit, then the additional sensor was placed on the front side of the flyers chest.
All executions except the first Toss prep were instructed to be thrown as high as possible.
When the flyer was wearingThe following movements were captured when the flyer was wearing the suit, in the same order as listed here:
- Toss prep 2x
- Toss block 2x
- Toss block / prep - base variation
- Base no-grip (fists) 2x
- Toss block / prep - flyer variations
- Dead Toss 2x -> no jump from flyer
- Flyer mini dip 2x
- Flyer deep dip 2x
- Flyer big pre-dip jump 2x
- Flyer on toes pre-dip 2x
- Spins
- half hands → half block 2x
With the base wearing the suit, a smaller subset was captured:
- Toss variations
- Toss prep 2x
- Toss block 2x
- Toss block - base no-grip (fists) 2x
- Med-ball throw - holding the ball on the chest at prep level
- 9 kg med-ball 2x
- 15 kg med-ball 2x
- Walk up variations
- walk prep 2x
- walk block 2x
- Some bonus measurements
- rewind drill to cradle
- Toss QP
- half prep
Also An extra base did a few tosses with both flyers (base 3 - that being me 😉)
After writing all this down here, I realized that I had forgotten how many variations of stunts I recorded with the base wearing the suit. :D But all good, just more of goodness to be juiced out from that data. But we’ll get to that at a later time.
What does the suit measure
The suit with the sensors measures quite a few things. The type of sensor is called an Inertial Measurement Unit (IMU), a single unit actually holds multiple sensors. An accelerometer, a gyroscope and a magnetometer. With a bunch of algorithms that process the data. We can get the acceleration of each sensor unit, with the effect of gravity removed as well as an absolute orientation of the sensor.
The MVN Analysis Software goes a step further and integrates information about how the human skeleton is set up and data from the sensors to build a skeleton representation of the human body. So in the end, not only do we get accelerations and orientations of each individual sensor. But position and orientation of each body segment that the sensor was placed on.
To get velocity and position the data is integrated, once to get velocity and twice to get position. This double integration can cause issues. But Movella’s algorithms did a good job mitigating a lot of the potential issues.
The process is more generally called Motion Capture. There are different ways to achieve this, each one coming with its own pros and cons.
Time Series Data - Position
There are multiple ways to dig into the data in order to find useful information for coaches and athletes. We could look at some values and see how the evolve over time.
For example, lets have a look at how the pelvis moves during a toss prep.
The pelvis moves down and up, and then down again during the pop off. And if we plot the vertical movement in a time series graph, it looks like this.
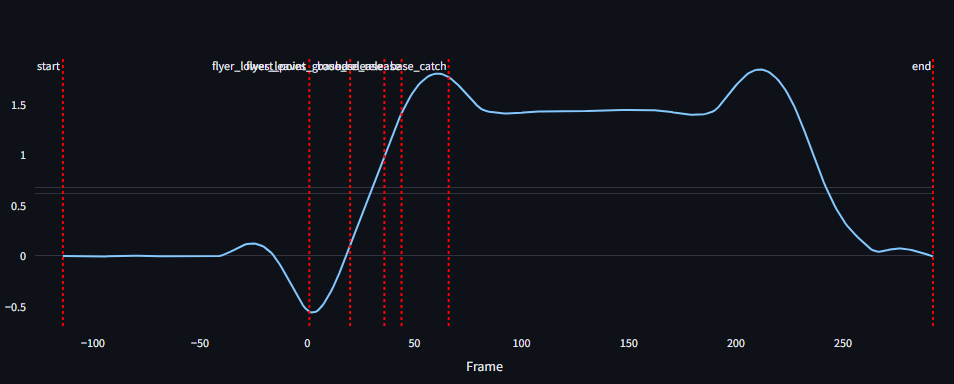
Here we want to see the maximum value as high as possible, it is the direct representation of the height.
The Events
The red lines show when certain events happen. They help us understand what phase of movement we are at.
Note that the events were annotated by looking at the video. While I did a good effort to try and synchronize the video and sensor data, there are some shifts between them at times.
Theses are the events:
- start - an arbitrary point before the action begins
- flyer_lowest_point - lowest point of the pelvis
- flyer_leaves_ground - when flyers feet leave the ground
- base_leaves_ground - when bases feet leave the ground
- base_release - when base releases the grip on the hips
- base_catch - when the bases hands catch the flyers feet
- end - a bit after the flyer has landed after pop off
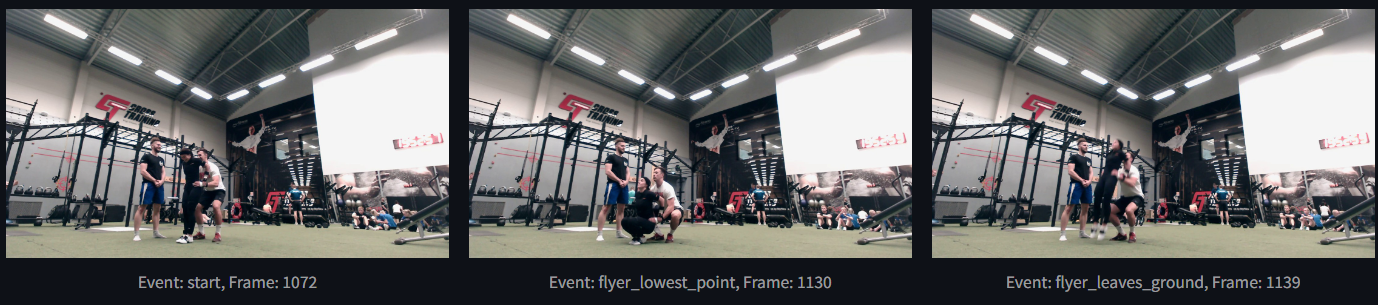
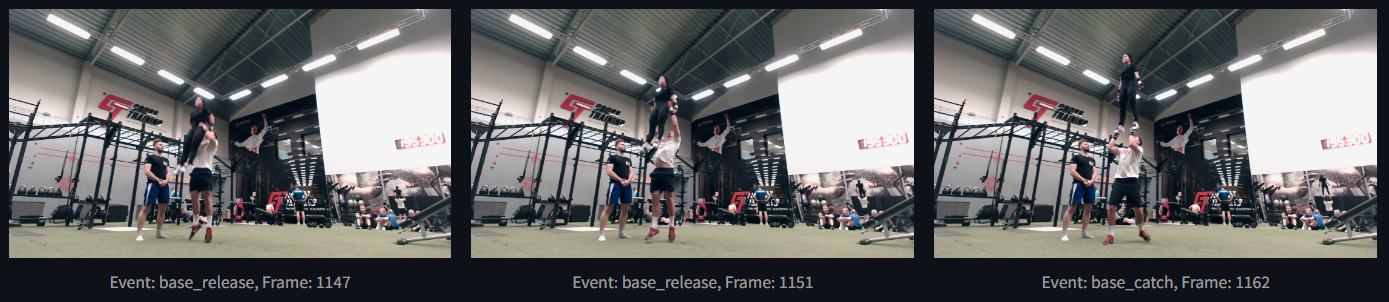
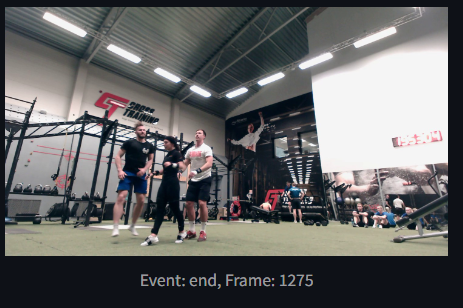
Here are snippets from the video, in all the events.
Time Series Data - Velocity
The second graph I want to introduce is the vertical velocity of the flyers pelvis as seen below. Now we have a second line overlaid on the first.
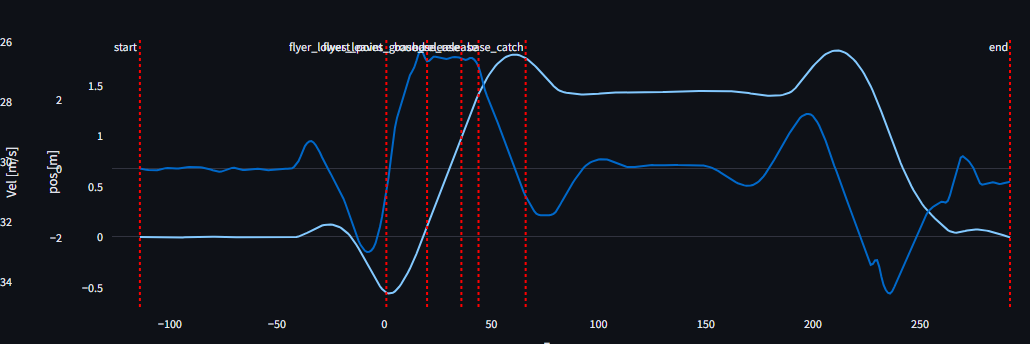
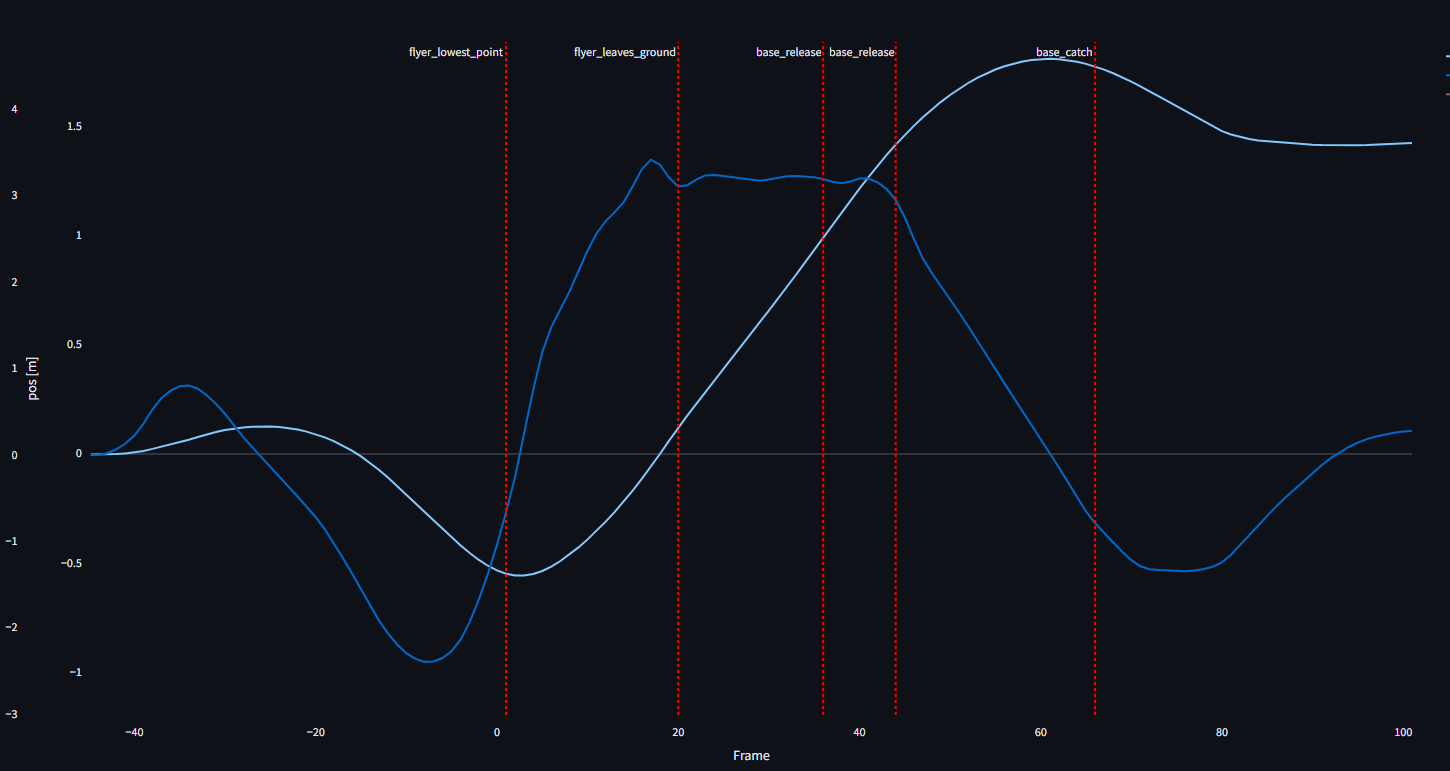
Since we want to maximize the height, we care about everything that happens before peak height is achieved. That is where I have also annotated all the events, except the more arbitrary start and end. So lets zoom in. Here I have also aligned the axis so that 0 velocity and 0 position (normalised to flyers hip height) are aligned.
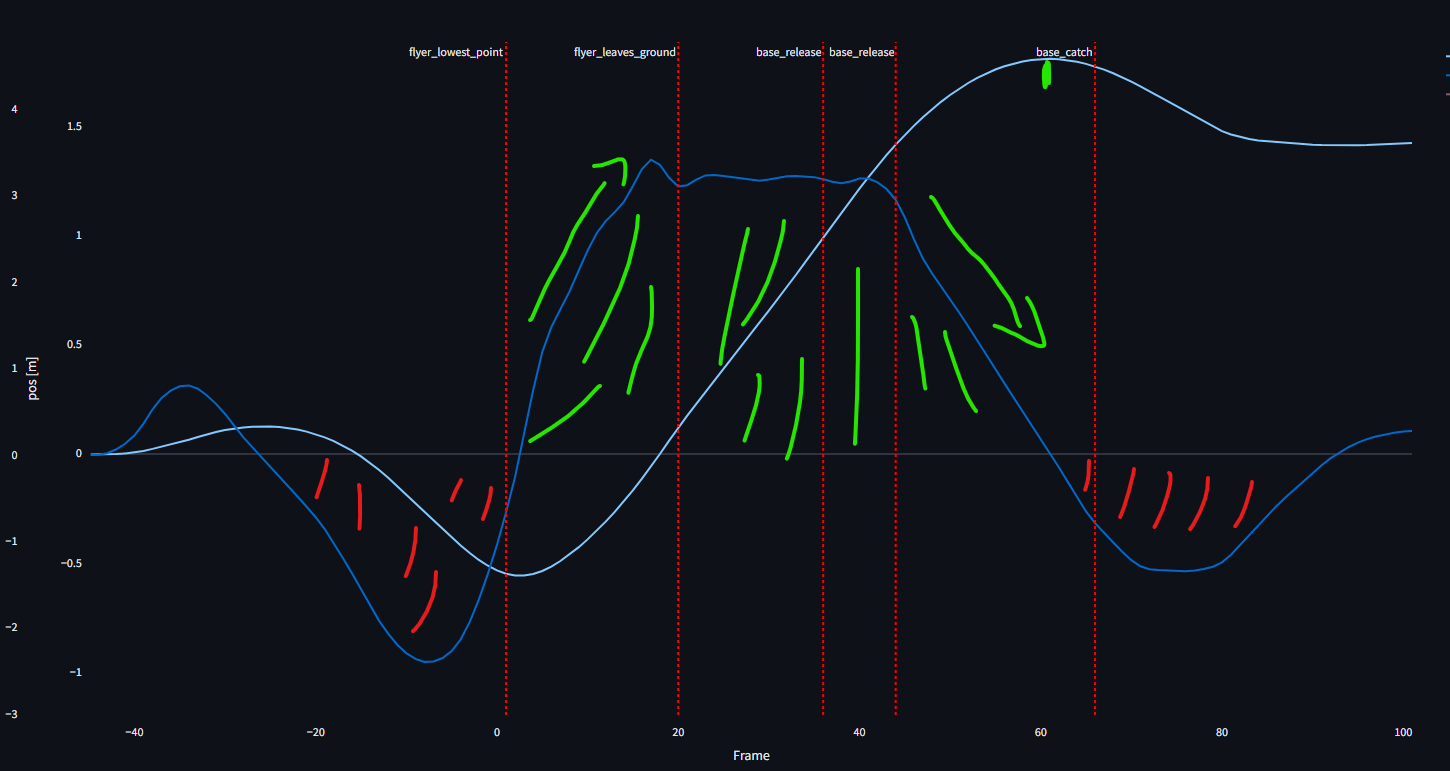
As the position goes up, we have the section of the velocity that is positive (green area), meaning the pelvis is moving up, as we also see in the position line. Before and after that part we have negative velocity, in these parts the pelvis is moving down (red area).
Maximizing Toss Height
So the fun part. In order to maximize the height of our toss, we want the green area to be as large as possible.
Our maximal velocity (MAX in red) determines the height (H) of the whole thing. And how well we can maintain that velocity until base release makes it wider (W). After release, it is all up to gravity to slow the flyer down, so the flyer should obviously grow some wings , to further increase velocity 😉. But on a serious note, there is not much to do after this point, but for the flyer to keep tight, hold the line and brace for landing.
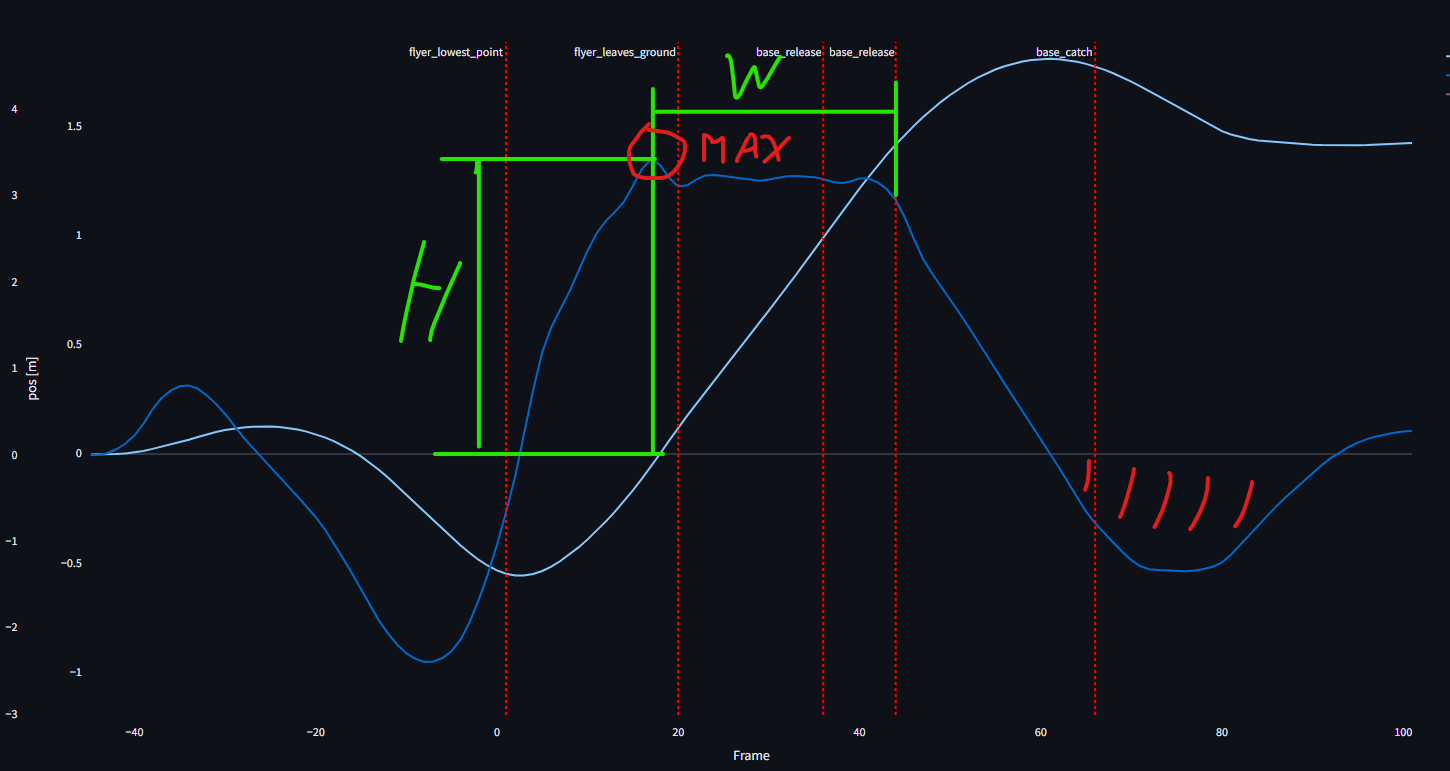
An important observation here is that for particular case and many others. Is that the only time we see substantial increase of velocity is from flyer_lowest_point to flyer_leaves_ground. So this is the crucial part where both the base and flyer work together to gather as much speed as possible.
If the max speed is low from the start, it will be extremely hard to make up for it. The base would have to have massive upper body strength and power to make up for the loss. So for most of us mortals, work needs to start as soon as the flyer starts moving up. Both with the legs and the arms, with the legs of course being stronger for most people (except the gym bros who skip leg days).
With that said, the job is not done after the flyer leaves the ground, and the base needs to continue pushing to maintain the velocity until the release. Even after the base leaves the ground, by keeping the arms up allowing the flyer to push until both base and flyer release. As we see from the graph, the flyers velocity can be maintained.
Phases Overview
Lets look at the same graph, and describe the phases between the events. With the red lines being events, and the yellow labels with numbers, being the phases between the events.
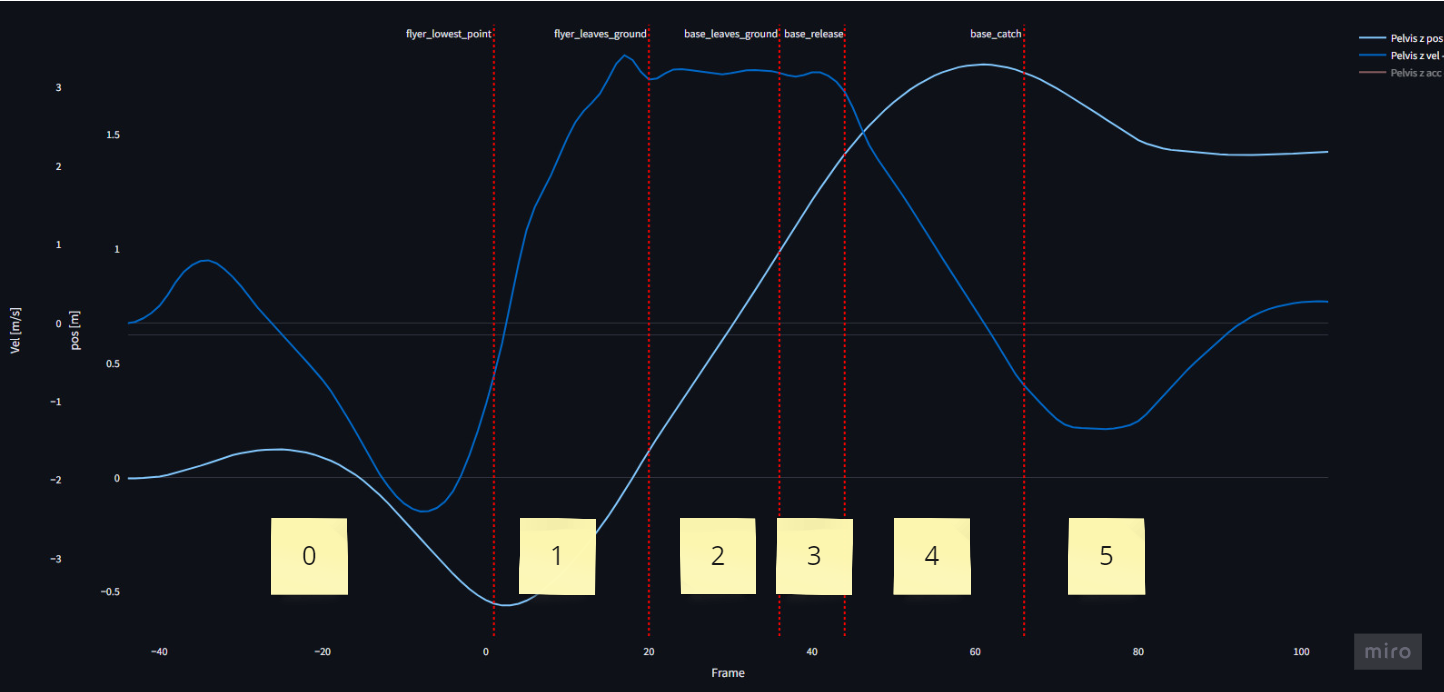
Here is also a little table, describing what happens during the phase, and who contributes to the vertical force during the phase.
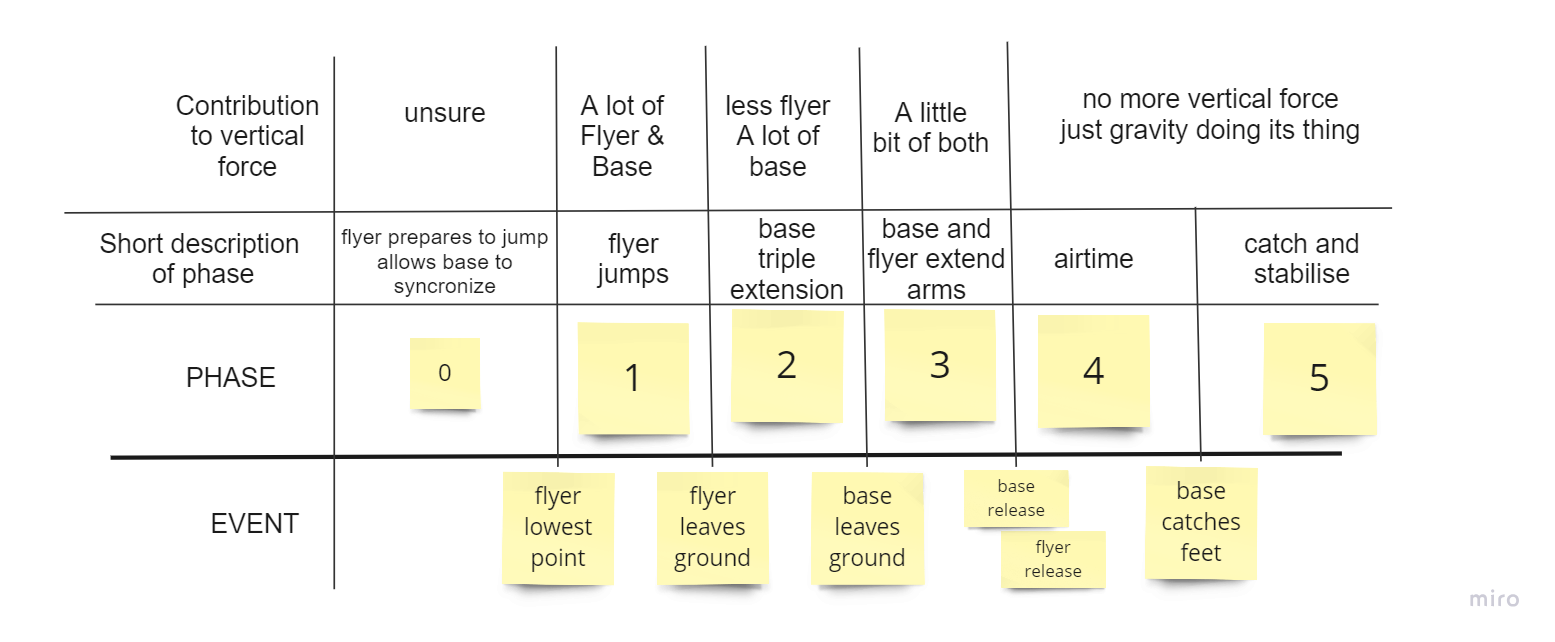
Now as we did not measure force, but we can apply our logical thinking powers. And visualize, how much the base and how much the flyer could contribute to the vertical force production over the phases. Then I imagine it would look something like this. The exact differences will for sure vary, but I believe the relations are plausible.
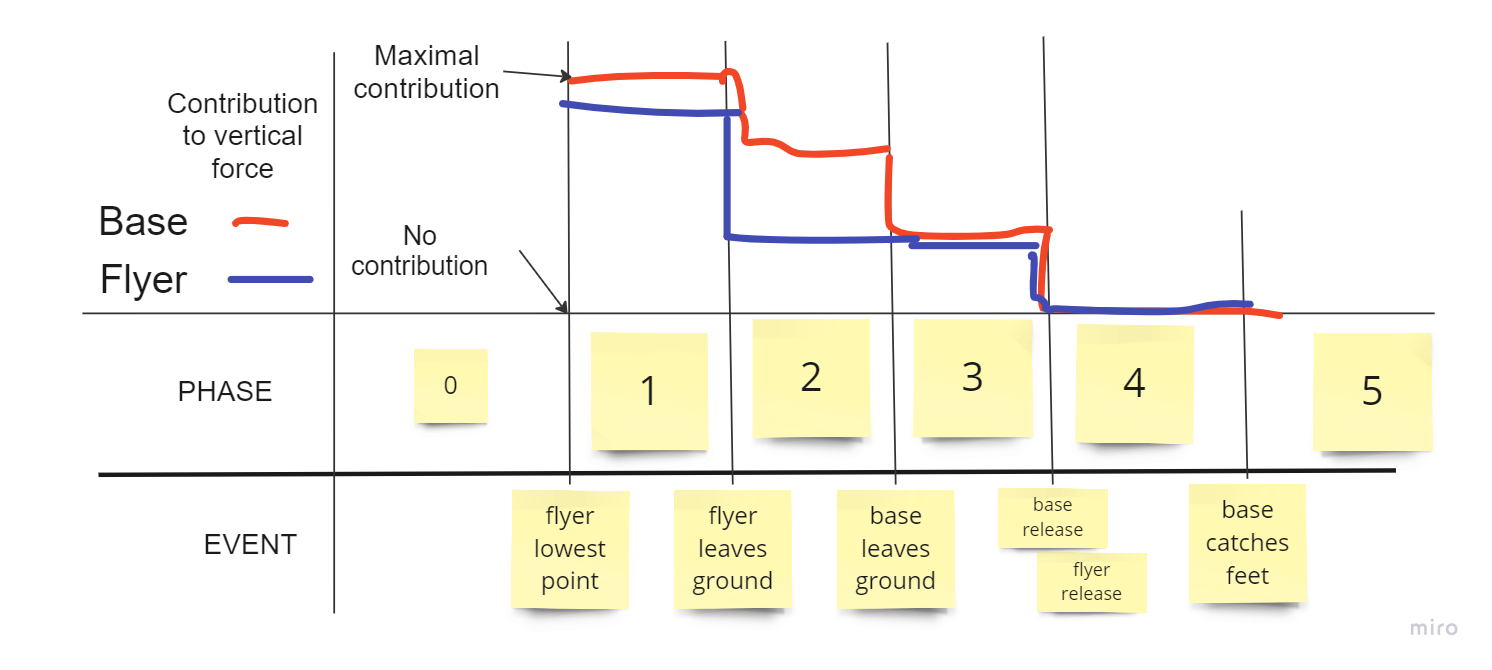
Since the base is usually bigger and stronger, there should be more fore production overall from the base. After the flyer leaves the ground, they can do significantly less, but still need to keep tight, so that the force from the base would be transferred to generating more height. After each phase shift, the base can do less and less. So again, we need to work hard from the beginning of the toss to maximize height gains.
And imagine, if you want to add 2 spins to the toss, a double up, you need to spent the later stages to spin. That is made possible if phase 1 is sufficiently good, so we can focus more on the spin and less on extra height in the later stages.
The end
If you made it so far, then congrats and I hope you learned something valuable. 🪙
If you have questions be sure to reach out. I’m happy to answer any questions that might have arisen.